Prime Day 2.0, Profitability Challenges for Amazon, & Omni Benchmark
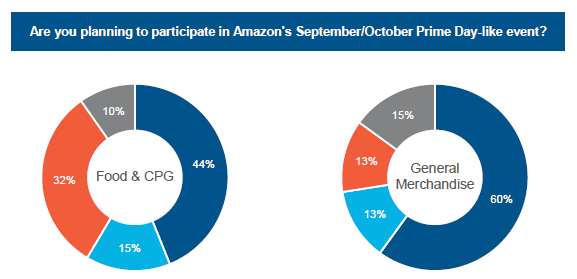
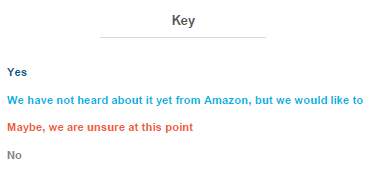
By Cleveland Admin60% of General Merchandise and 44% of Food & CPG brands plan to participate in Prime Day #2:
Last In our latest benchmark, we found that over half of vendors are planning on participating in Amazon’s Prime Day-like event this Fall with another 30-35% still evaluating the opportunity. Given this event was unknown heading into the year, many brands are having a hard time finding the funding to fully participate in the event in an environment where budgets are being squeezed and many brands are pulling back on promotional, marketing, and advertising dollars. Feedback indicates some vendors feel like they are having to choose between this second Prime Day event and the holiday / Turkey-5 promotional time period. Finding extra funding / trade dollars during what would be considered a down year for many vendors is proving to be challenging. That being said, there have been a few brands who are excited about this additional merchandising opportunity given they typically see a strong lift during fall promotions due to their category (i.e. Back-to-School or Halloween products).
Amazon still facing cost pressures, 2023 AVN conversations may focus more on profitability:
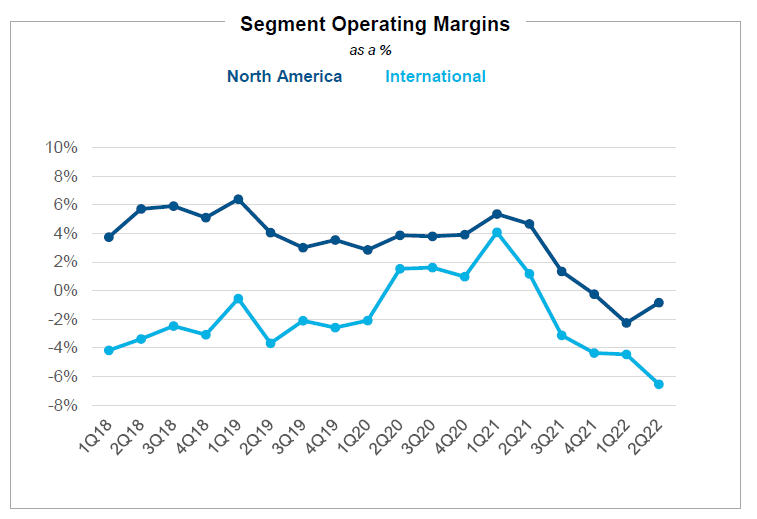
Despite a nice lift from advertising this quarter, Amazon is not immune to the cost pressures retailers across the board are currently facing. Since the start of 2022, Amazon has outlined 3 major cost headwinds: 1) inflationary pressures, 2) reduced productivity, and 3) reduced fixed cost leverage. In Amazon’s 2Q earnings call, they noted that they have made improvements to address the second item (productivity) but that inflation and fixed cost issues remain. What this means for brands is that because Amazon’s bottom line is being pressured, 2023 AVN discussions may be more of a challenge as Amazon will likely be more anxious to recover profits lost over the last 12-18 months. This is in contrast to 2022 AVNs that didn’t even happen for some brands without a Vendor Manager in the seat.
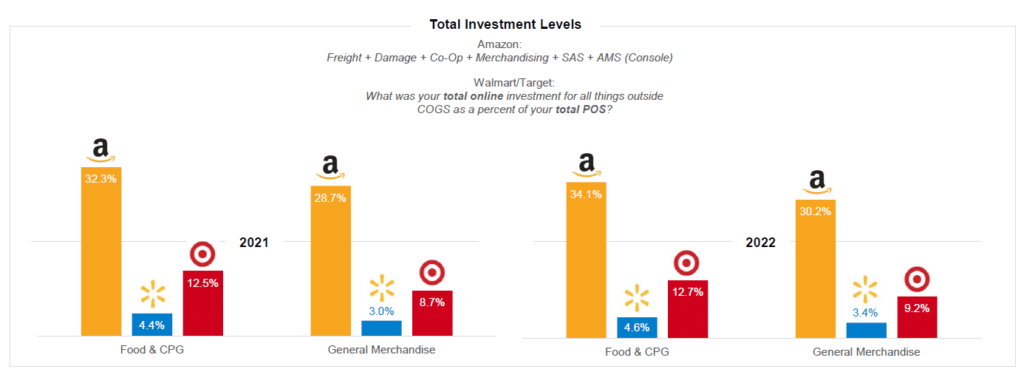
Investment level: Amazon vs. Walmart.com vs. Target.com:
In our report consolidating results from various CRC benchmarks, we compare vendor investments across Amazon, Walmart.com and Target.com. The report compares digital investments to total POS (including in-store for omni-retailers). We explore topics including: current and expected advertising spend, digital penetration, total investment levels, usage of 3P partners, and more. Many of the slides should be viewed on a relative basis as the difference in online volume done between the retailers remains quite large. Specifically, the size, maturity, and sophistication of Amazon demands a disproportionate level of investment compared to Walmart and Target. Each retailer has its own nuances, such that, this report is meant to give directional insights.
